how to configure Grafana with Prometheus
Today, let's find out how to install Grafana using the Helm chart and how to configure Grfana with Prometheus.
Configure Grafana
Grafana is an open-source toolkit for visualizing time series data. It is often used to visualize the metrics or log information of resources. The characteristics are summarized as follows.
- Data integration and transformation
Visualize by collecting data dynamically and not dependent on backend storage or database.
Support various operation performance functions for different queries and data sources.
- Various plug-ins are supported.
It supports a variety of data source plug-ins with real-time rendering.
- Notification support.
Support notification and management functions in visualized UI.
- Customizing dashboards.
install Grafana using Helm Chart
Add Helm Repository for Grafana installation.
$ helm repo add grafana https://grafana.github.io/helm-chartsDownload Grafana Helm Chart.
$ git clone https://github.com/grafana/helm-charts.gitMove to the location where the values.yaml file is located.
$ cd helm-charts/charts/grafanaOpen the values.yaml file to set the admin account to use in the Web UI.
$ vi values.yaml

...

# Administrator credentials when not using an existing secret (see below)
adminUser: admin
adminPassword: ${adminPassword}

...
Next, to check the service in the browser, change ClusterIP to LoadBalancer and specify the LoadBalancer option as below.
Create a namespace and install Grafana using helm chart.
$ kubectl create namespace (namespace)$ helm install grafana grafana/grafana -f values.yaml --namespace (namespace)
NAME: grafana
LAST DEPLOYED: Fri Sep 17 17:16:09 2021
NAMESPACE: (namespace)
STATUS: deployed
REVISION: 1
NOTES:
1. Get your 'admin' user password by running:
kubectl get secret --namespace monitoring grafana -o jsonpath="{.data.admin-password}" | base64 --decode ; echo
2. The Grafana server can be accessed via port 80 on the following DNS name from within your cluster:
grafana.monitoring.svc.cluster.local
Get the Grafana URL to visit by running these commands in the same shell:
export NODE_PORT=$(kubectl get --namespace monitoring -o jsonpath="{.spec.ports[0].nodePort}" services grafana)
export NODE_IP=$(kubectl get nodes --namespace monitoring -o jsonpath="{.items[0].status.addresses[0].address}")
echo http://$NODE_IP:$NODE_PORT
3. Login with the password from step 1 and the username: admin
#################################################################################
###### WARNING: Persistence is disabled!!! You will lose your data when #####
###### the Grafana pod is terminated. #####
#################################################################################When the installation is complete, check the pod and service.
Grafana web UI
Add Prometheus Data Source
fill out the information about Prometheus to be linked and click the 'Save & Test' button. When linked normally, a message called 'Data source is working' appears.
Create the Grafana Dashboard
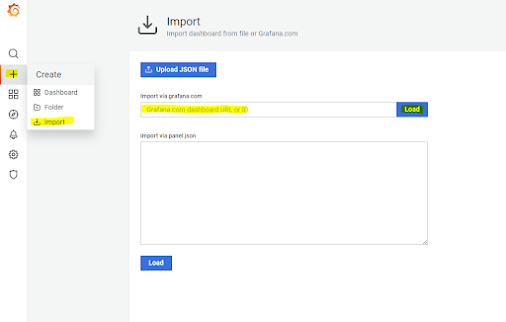
Click the 'Create' > 'Import' menu in the left menu. When the screen appears, enter the Dashboard ID and click the 'Load' button. Grafana Labs offers a variety of built-in dashboards and used the ID of the Kubernetes Cluster for practice.
reference: Grafana Labs -> https://grafana.com/grafana/dashboards/


Comments
Post a Comment